Randy Knight: Our Passive - Solar Straw Bale House & Its Performance Data
Atascadero, CA
Atascadero, CA

Architect: Jennifer Rennick
Architect. Certified Energy Analyst. InBalance Consulting.
2410 Leona Avenue, San Luis Obispo CA 93401 805.423.8359
email jennifer@inbalancegreen.com www.inbalancegreen.com www.losaltospassivesolar.com
A graduate of California Polytechic State University, San Luis Obispo
Architect. Certified Energy Analyst. InBalance Consulting.
2410 Leona Avenue, San Luis Obispo CA 93401 805.423.8359
email jennifer@inbalancegreen.com www.inbalancegreen.com www.losaltospassivesolar.com
A graduate of California Polytechic State University, San Luis Obispo
Randy Knight Professor of Physics, California Polytechnic State University
805.756.1663 805.756.2435 fax rknight@calpoly.edu
805.756.1663 805.756.2435 fax rknight@calpoly.edu
Builder: Semmes & Co., Atascadero CA
Completion Date: July 2009
Completion Date: July 2009
Roof-mounted, 16 Mitsubishi 185 watt panels, for a nominal 2.96 kW DC at the panels. Rated power of solar panels is for 1000 W/m2 solar intensity perpendicular to the panels. I don't yet have a solar intensity measurements (coming soon!), but we should meet or exceed that at solar noon through much of the summer.
Fronius IG 3000 inverter with data logging. Stated maximum efficiency is 95%, which should turn 2.96 kW DC into 2.8 kW AC at the grid. We don't get this. Maximum AC power has been 2.68 kW, but 2.5 kW is a more typical AC power at solar noon in summer. Not sure why it's 10% less than expected, but this seems typical of other systems.
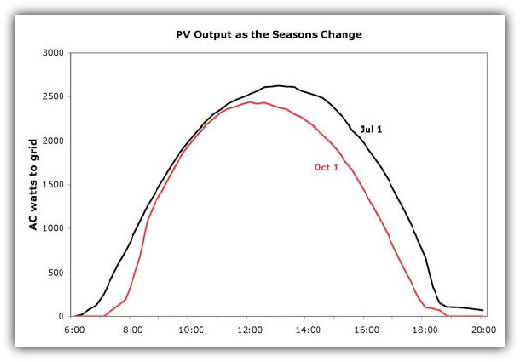
Roof is sloped at 18.4° (1-to-3 rise to run) and angled about 20° east of south (an azimuth angle of 160°). I've calculated that the sun is directly perpendicular to the panels on May 8 and August 4. Solar energy incident on the panels decreases with the cosine of the angle between the sun's rays and a line perpendicular the panels. Because cos(18.2°) = 0.95, the peak power at solar noon should be =95% of its yearly maximum all the way from March 18 to September 25 the dates at which the noon angle to the sun is 18.2°. Finally, with the sun dropping lower in the sky, daily peak power should drop to 75% of maximum at the winter solstice.
Fronius IG 3000 inverter with data logging. Stated maximum efficiency is 95%, which should turn 2.96 kW DC into 2.8 kW AC at the grid. We don't get this. Maximum AC power has been 2.68 kW, but 2.5 kW is a more typical AC power at solar noon in summer. Not sure why it's 10% less than expected, but this seems typical of other systems.
Roof is sloped at 18.4° (1-to-3 rise to run) and angled about 20° east of south (an azimuth angle of 160°). I've calculated that the sun is directly perpendicular to the panels on May 8 and August 4. Solar energy incident on the panels decreases with the cosine of the angle between the sun's rays and a line perpendicular the panels. Because cos(18.2°) = 0.95, the peak power at solar noon should be =95% of its yearly maximum all the way from March 18 to September 25 the dates at which the noon angle to the sun is 18.2°. Finally, with the sun dropping lower in the sky, daily peak power should drop to 75% of maximum at the winter solstice.
3 KW PV System
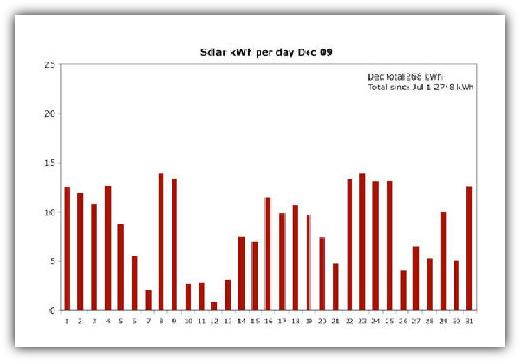
Most Recent Month's Data
This graph displays the total kWh generated per day for the most recent month. It will be updated each month shortly after the first of the month. Archived data for earlier months are at the bottom of this page.
For reference, July was right at 20 kWh per day every single day. Always full sun here in the summer! Winter has shorter days, the sun is lower in the sky, and many days are partially or totally cloudy. Total December production was 45% of total July production.
The Daily Curve
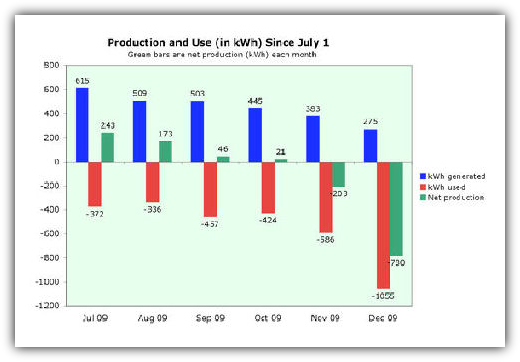
Net Production